problem
no single source of truth for pricing decisions
Analysts have to rely on various data points in an attempt to create a realistic picture of product pricing and its market. At scale, this leaves significant gaps capturing the true impact of pricing factors.
personal contribution
lead product designer
I conducted research, owned design deliverables, and orchestrated delivery between the data science team and business stakeholders.
goal
release a MVP that forecasts prices, globally
With a catalog that spans thousands of products, users needed to understand where the biggest price impacts are expected to occur, and what factors are driving those changes.
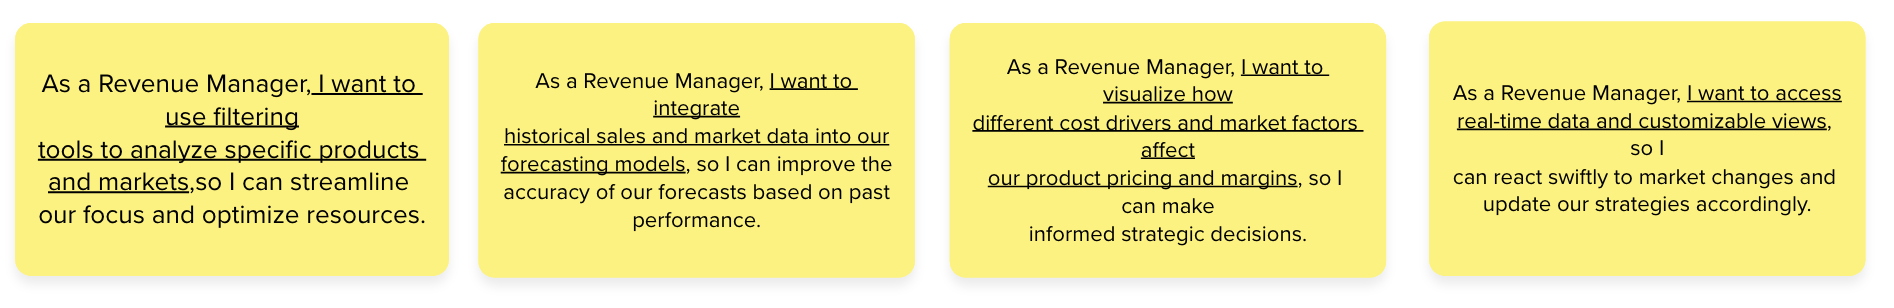
users & archetypes
Pricing & Revenue teams
The power users of the platform - business analysts, had to pull together information from disparate resources like industry reports & internal files. Split into three teams, they monitor products from inception to completion. They must pass pricing recommendations to Sales teams, who are often reluctant.

The archetypes helped the team think through the initial design concepts and drove a user-focused narrative that vastly cut down on the time it took to align on a starting concept.

discovery & agile planning
experience journey map & user stories
As part of the initial discovery, I created an experience journey map that identifies user touch-points and all data inputs and outputs. This aligned stakeholders on long-term product intent and identified key moments of user interactions that needed prototype testing for the MVP.
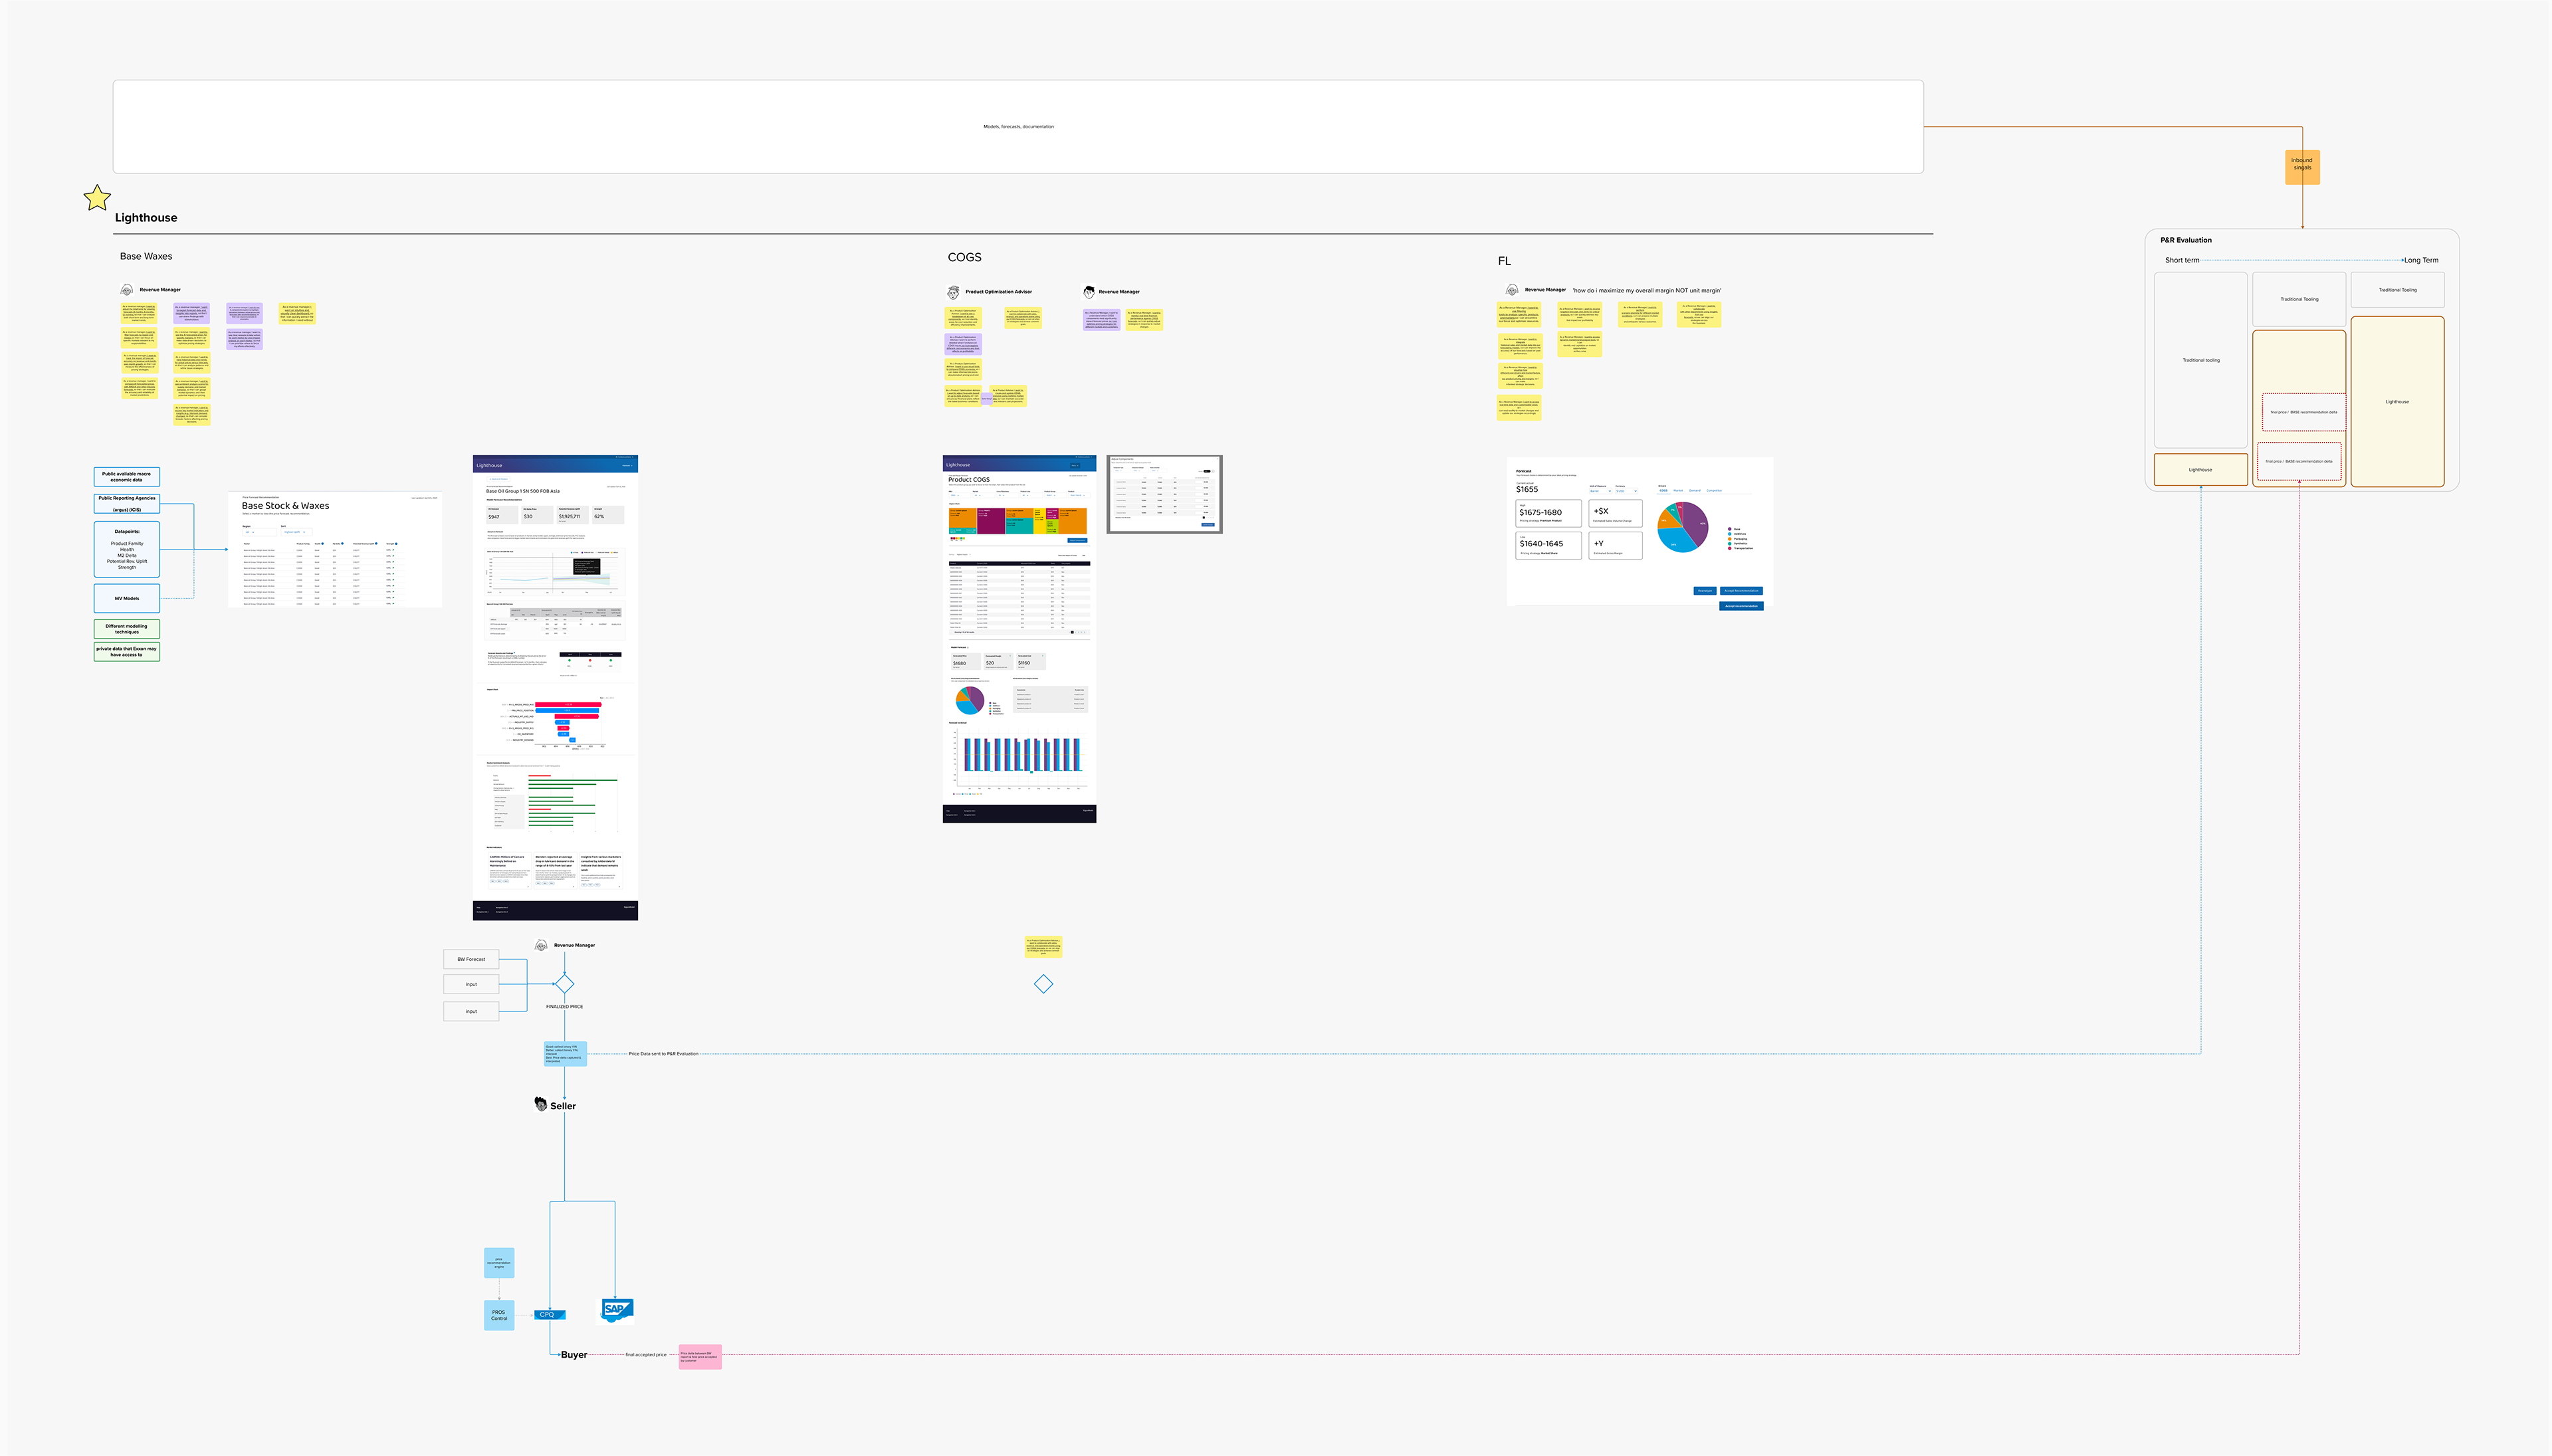
Data quality depends on each team providing pricing feedback, which results in a complete, real-time picture of cost factors that influence price.
Analysts in Base Stocks team needed to set the initial price of a product, focusing exclusively on costs at the source.
Those working downstream in Finished Lubes, access a model that has incorporated initial prices, improving the data legitimacy.
Mapping the flow of data and user interactions allowed the Product team to write agile stories for features in sequence, with confidence that the rendered product will function as intended.

design
driving focus using data hierarchy & visualization
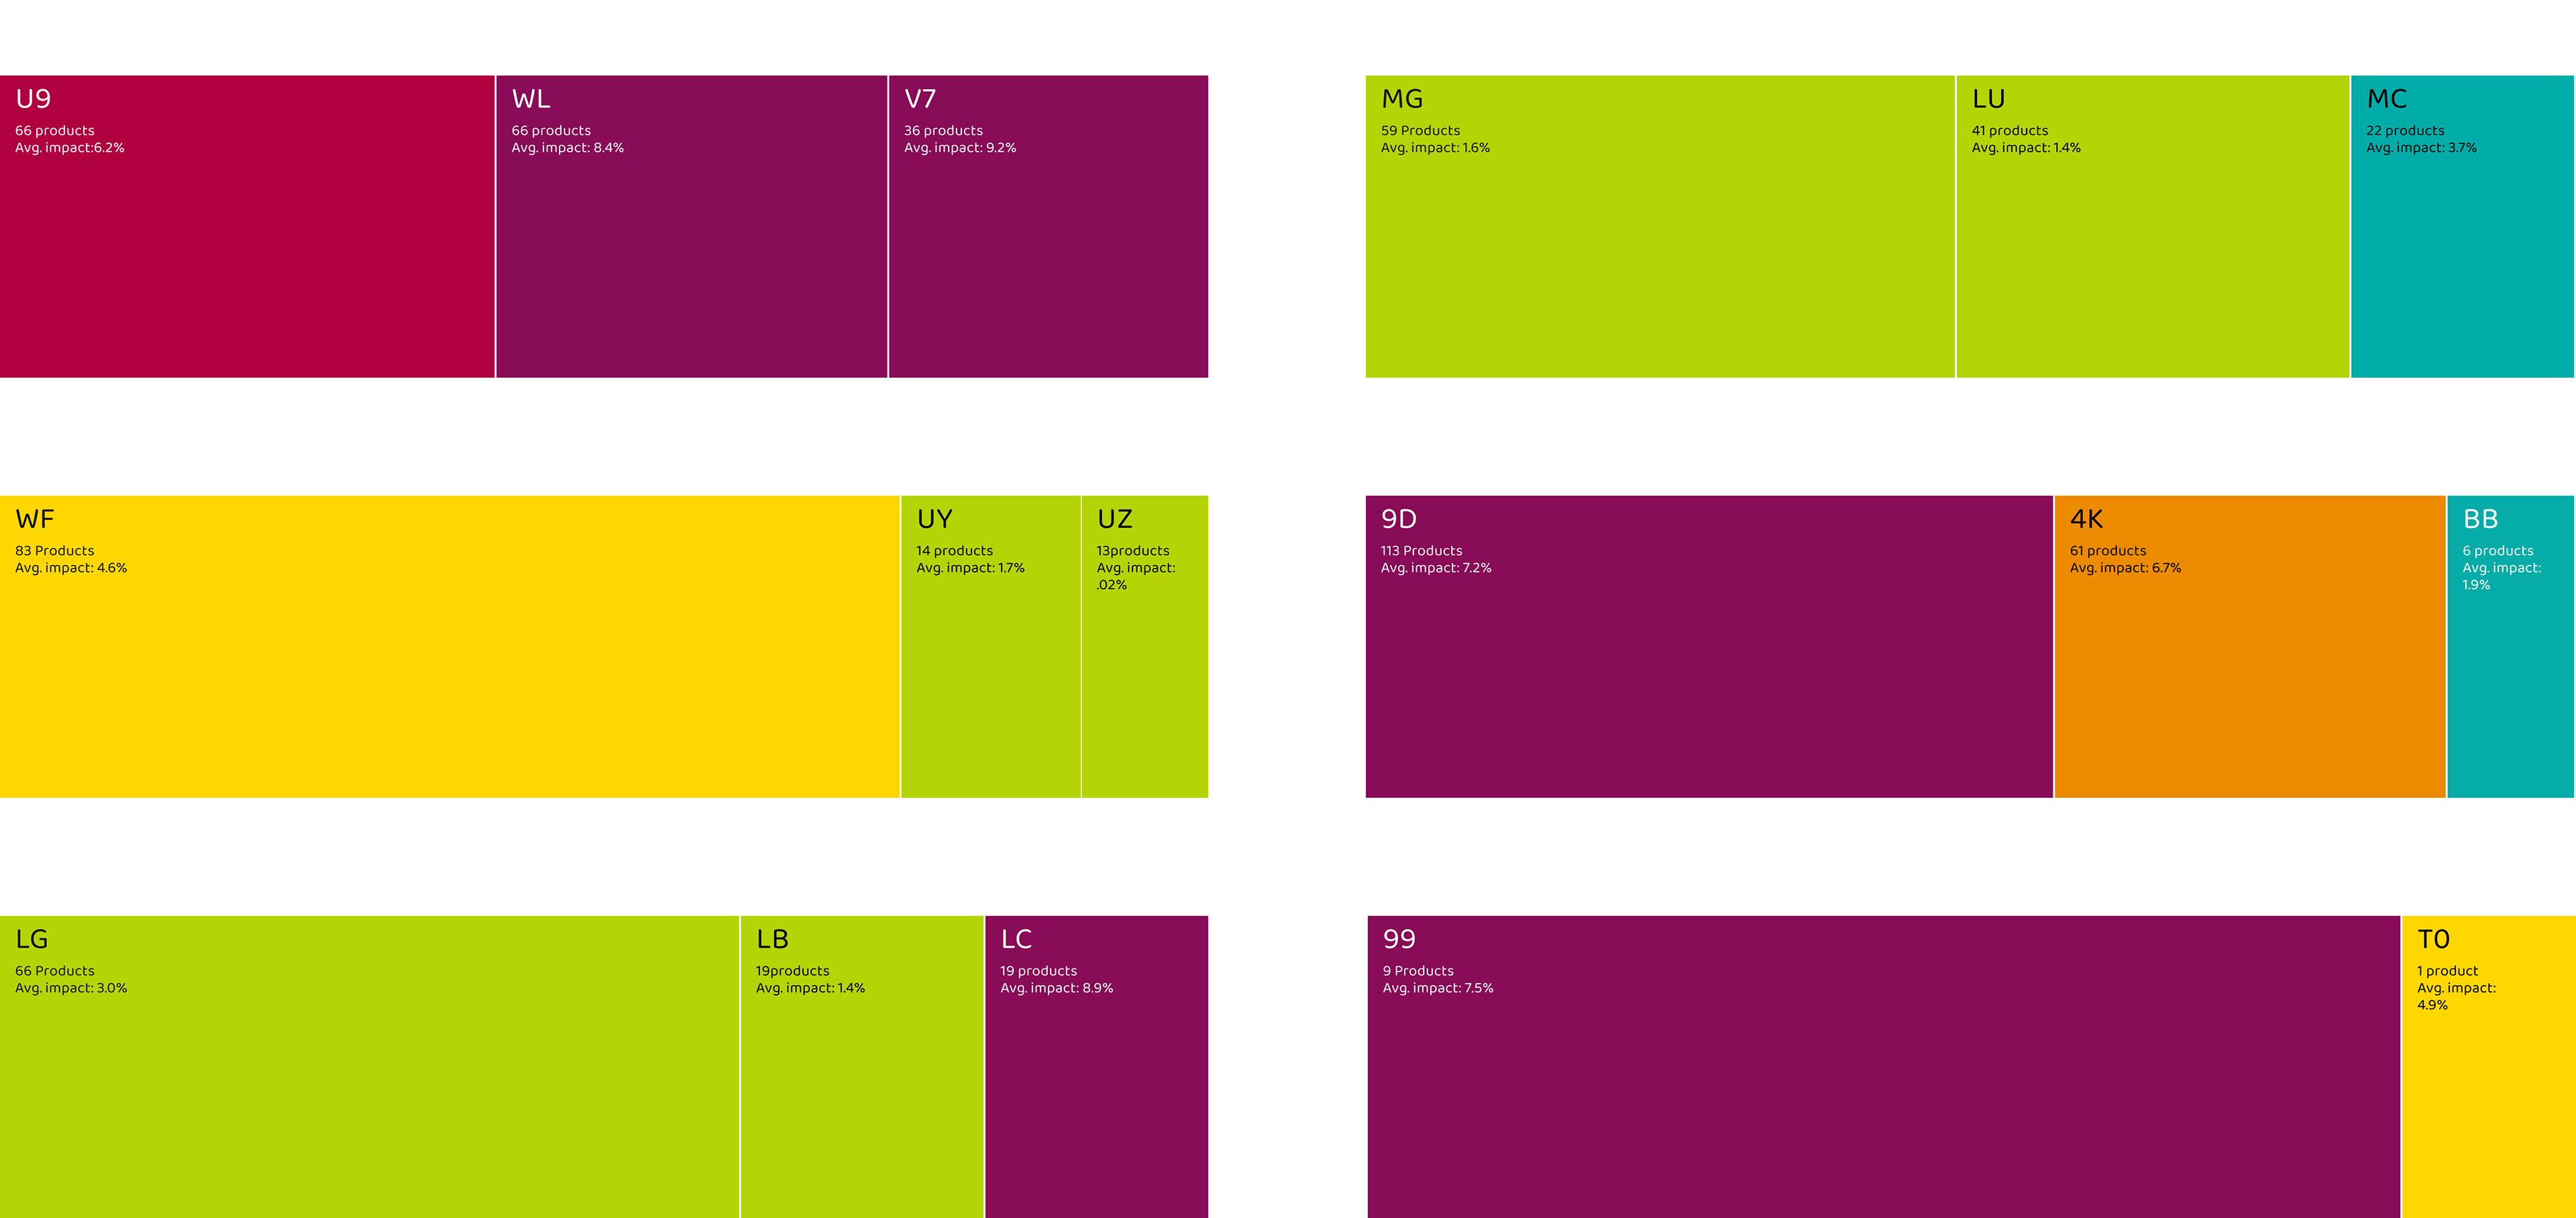
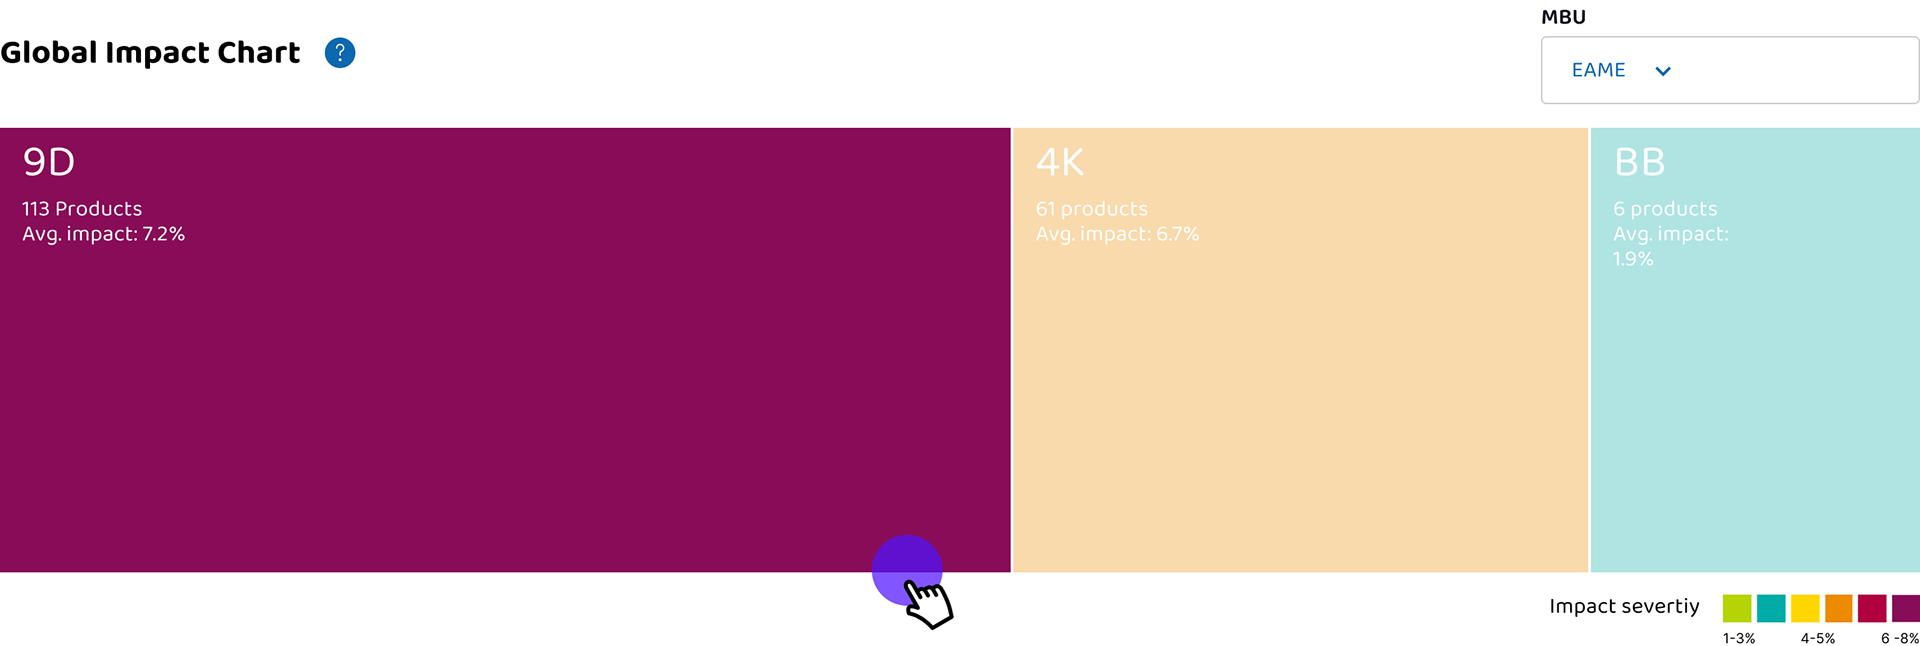
global heatmap
Heatmaps are conducive to showing large sets of data with 'natural mapping' that quickly communicates a great deal of information. This is why they were chosen as the first step for users to drill down into the vast quantity of data the tool delivers.
global
The size of each piece is dictated by the number of products it carries, while the color represents the absolute percent change in price across all the products. Large boxes that are dark red mean there is a lot of change and a lot of products will be impacted.

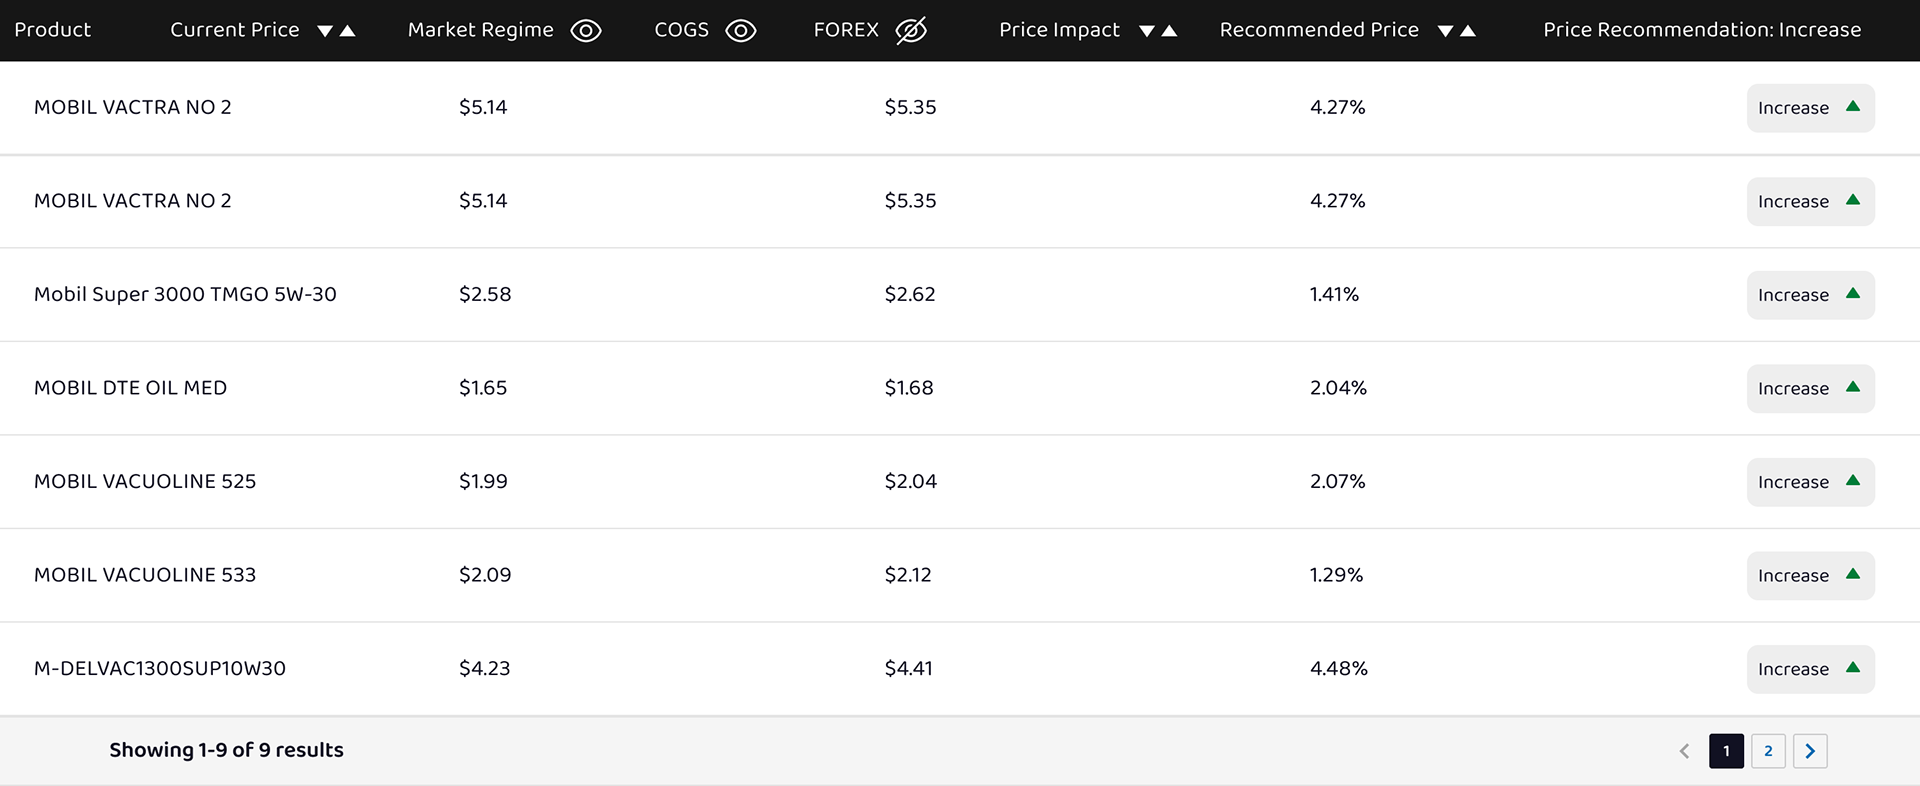
product list view
Once a user has found the geography they want to explore, they access a product segment and see the corresponding product list. There, they can sort by price recommendation for each specific product.

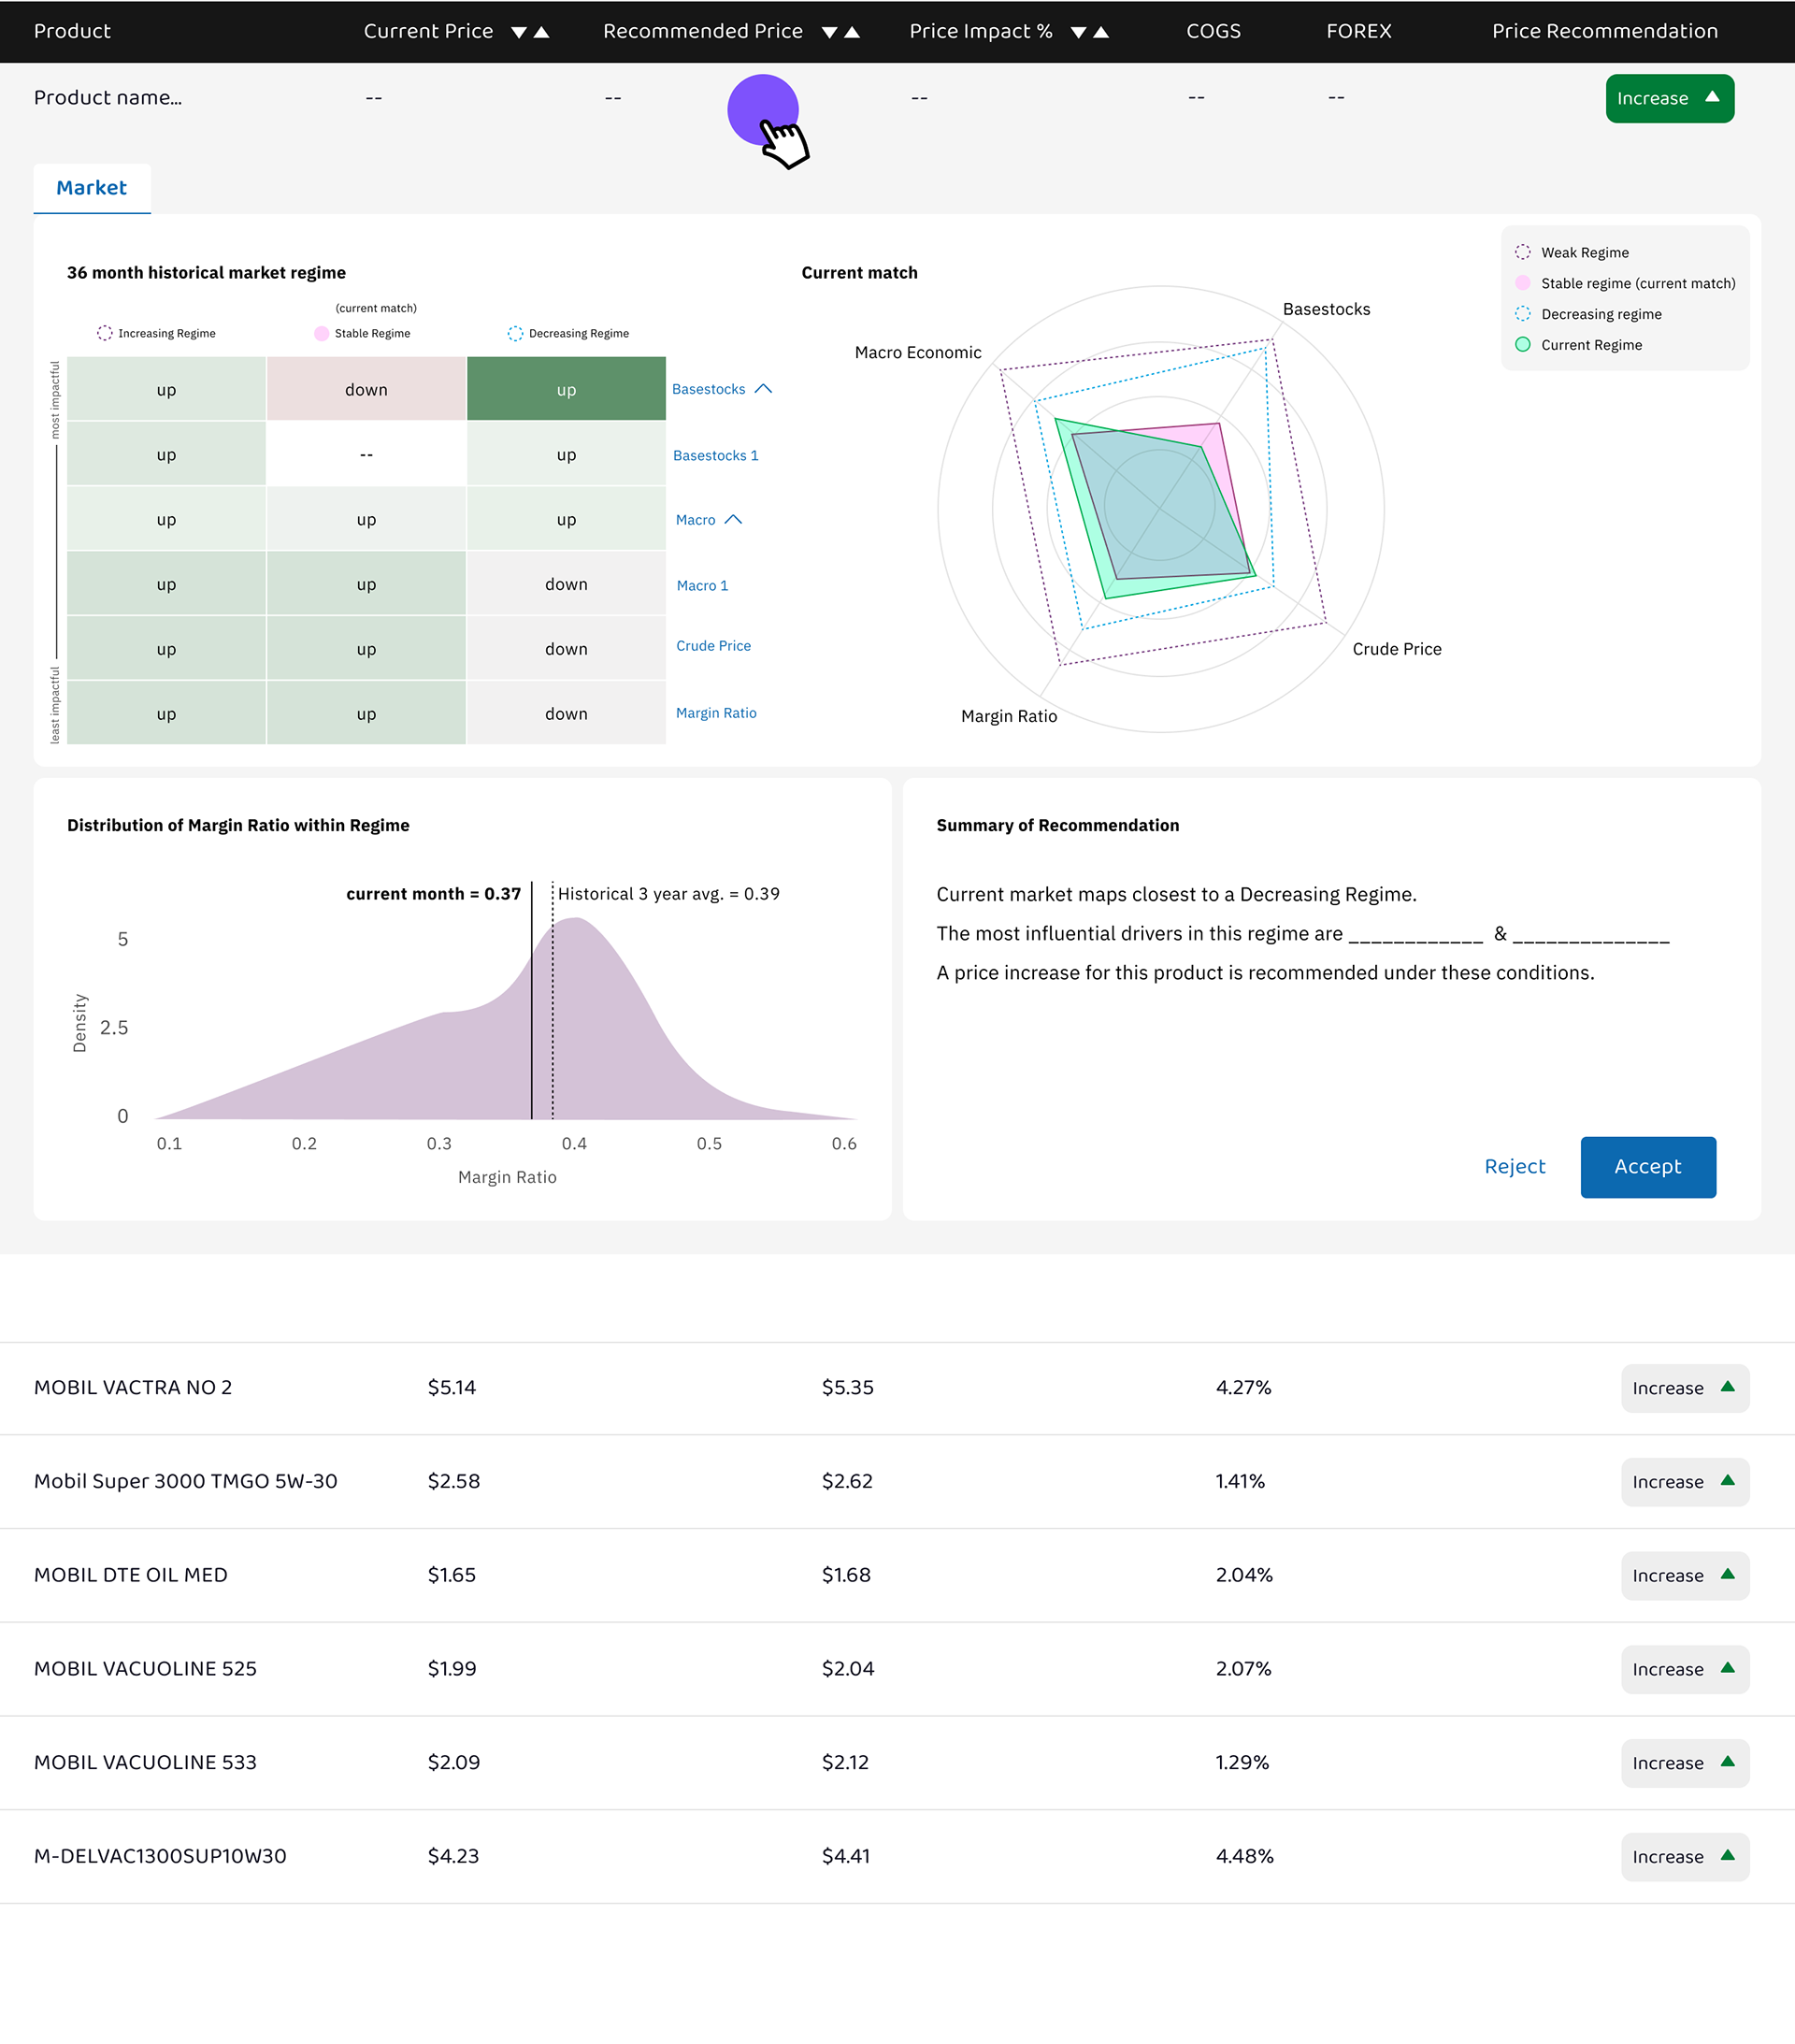
product pricing recommendation
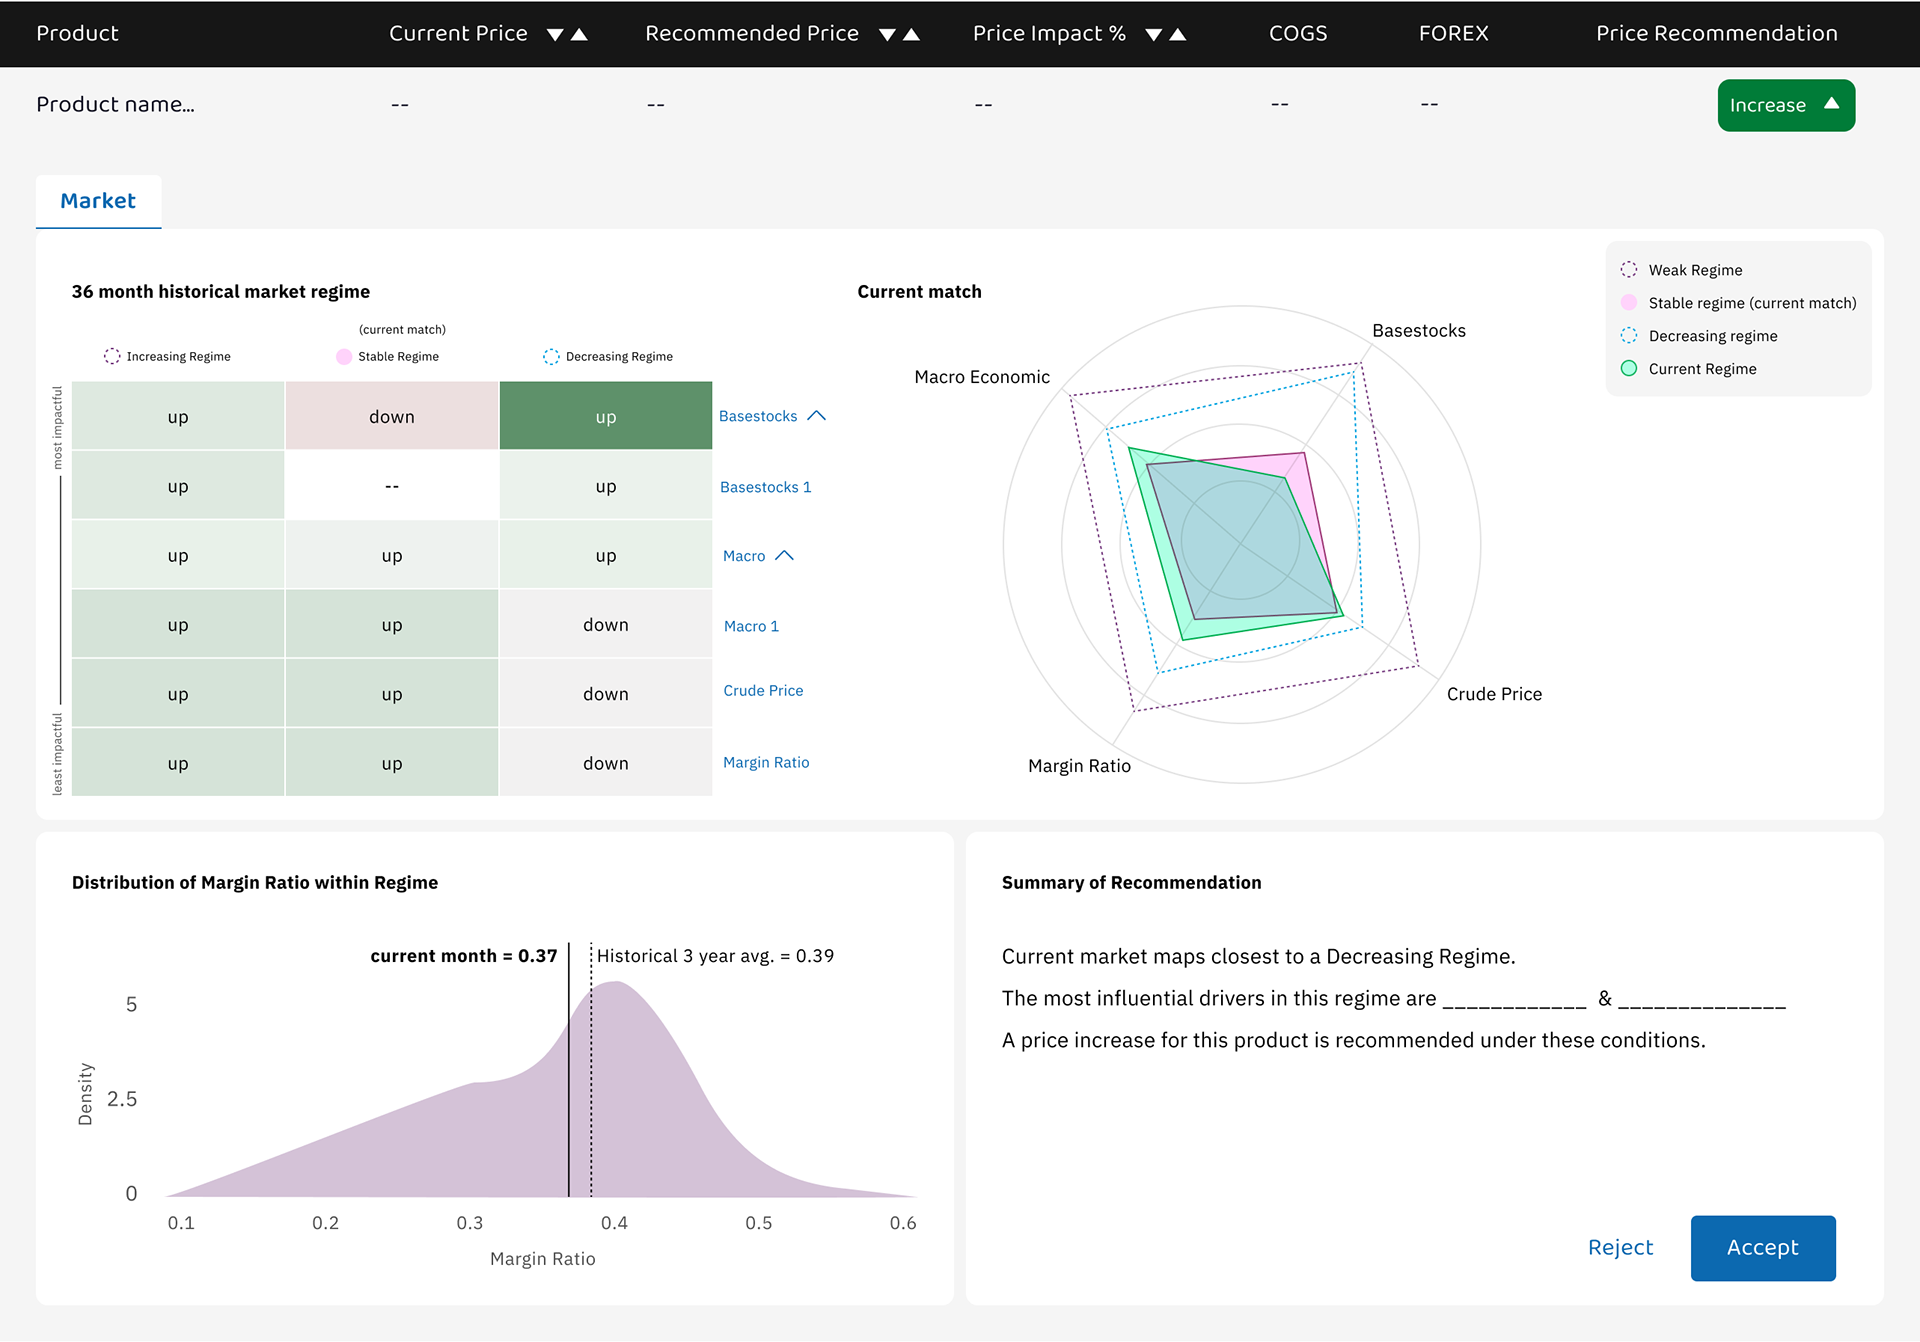
Users are able to drill down to the individual product level and see what factors are influencing the current price. This includes what 'market regime' is currently prevailing, how the factors match the current regime, and the margin ratio distribution.
product pricing recommendation
Natural language of the rational for the price recommendation of the given product is provided to tie all of the data together when analysts need to communicate with their sales counterparts.

user testing
User interviews & feedback
I created a prototype that helped analysts understand the hierarchy of data, and see actual figures attached to real-world products. This was a completely novel experience, delivering on the vision of the MVP.
Analysts requested a summary view, asked for changes to the calculation of price,and expressed hesitation to the depth of data that is being provided.
design change
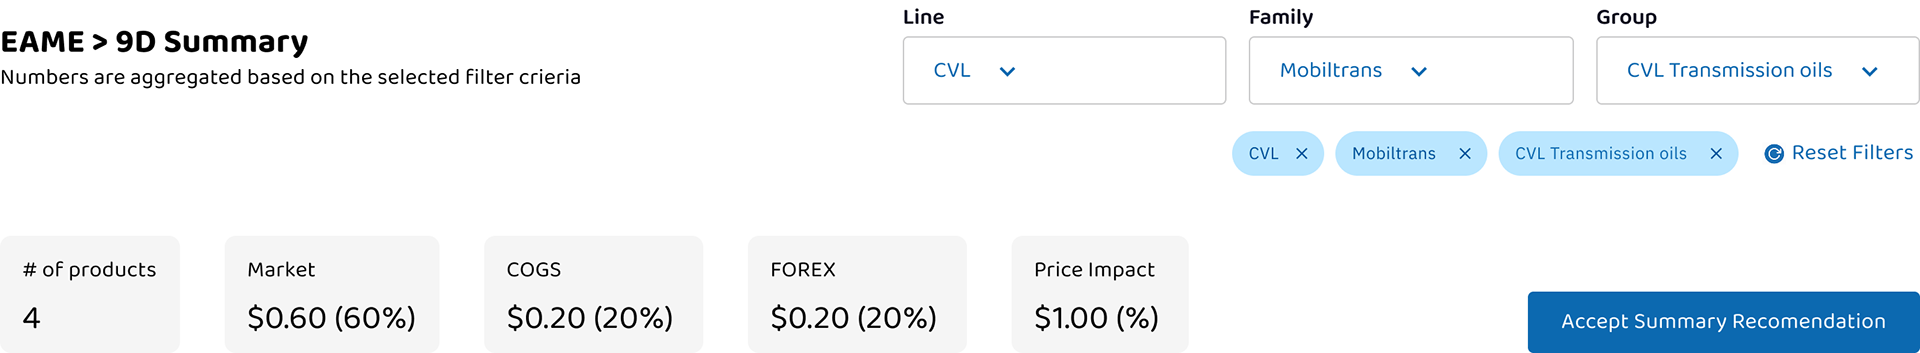
summary view
Once users had filtered down to their desired level (geography, product family, etc..), they wanted to see a summary of the metrics. They also expressed the desire to take a bulk action on all of the queried products.
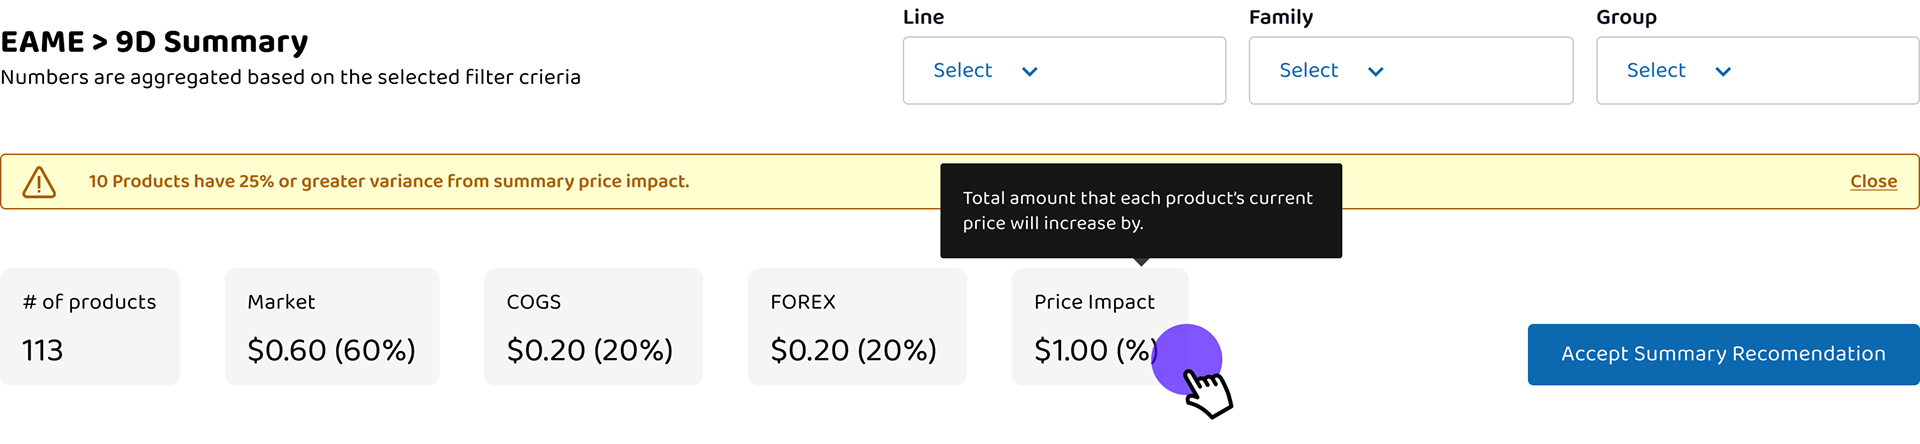

When the query of products contains price increases that exceed a threshold of 25%, a caution callout helps prevent errors in bulk actions that will result in high price variances.
The callout clears if no products exceed the predetermined threshold of 25%.

design change
price model adaptation
The prototype had expanded upon market regime alone, but the interest of analysts led us to incorporate the 'cost of goods sold' and FOREX metrics at the list view level.
design change
price model adaptation
With a show/hide affordance at the column headers, and a percentage next to the actual value, Analysts are able to see how each of the three factors impacted the recommended price.

original header
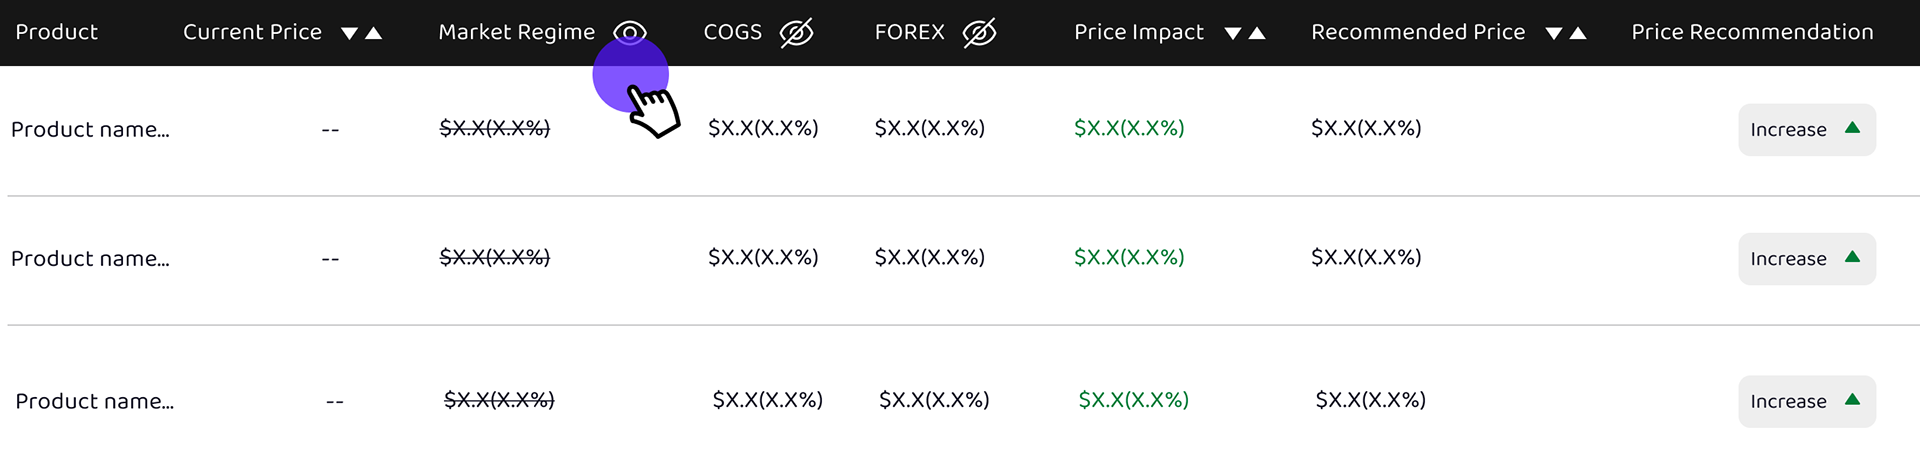
revised header

design change
streamlining data
When all is said and done, Analysts must be able to convince Sales teams to adopt new pricing on product. The data that this tool provides has not yet been accessible and so, expressing in the most optimal way took collaboration and testing.
design change
streamlining data
Analysts preferred less details around the market regime, and did not find the 'current match' chart helpful. They relied on the natural language explanation and wanted to edit pricing based on the market factors shown in the list view.
original product level data
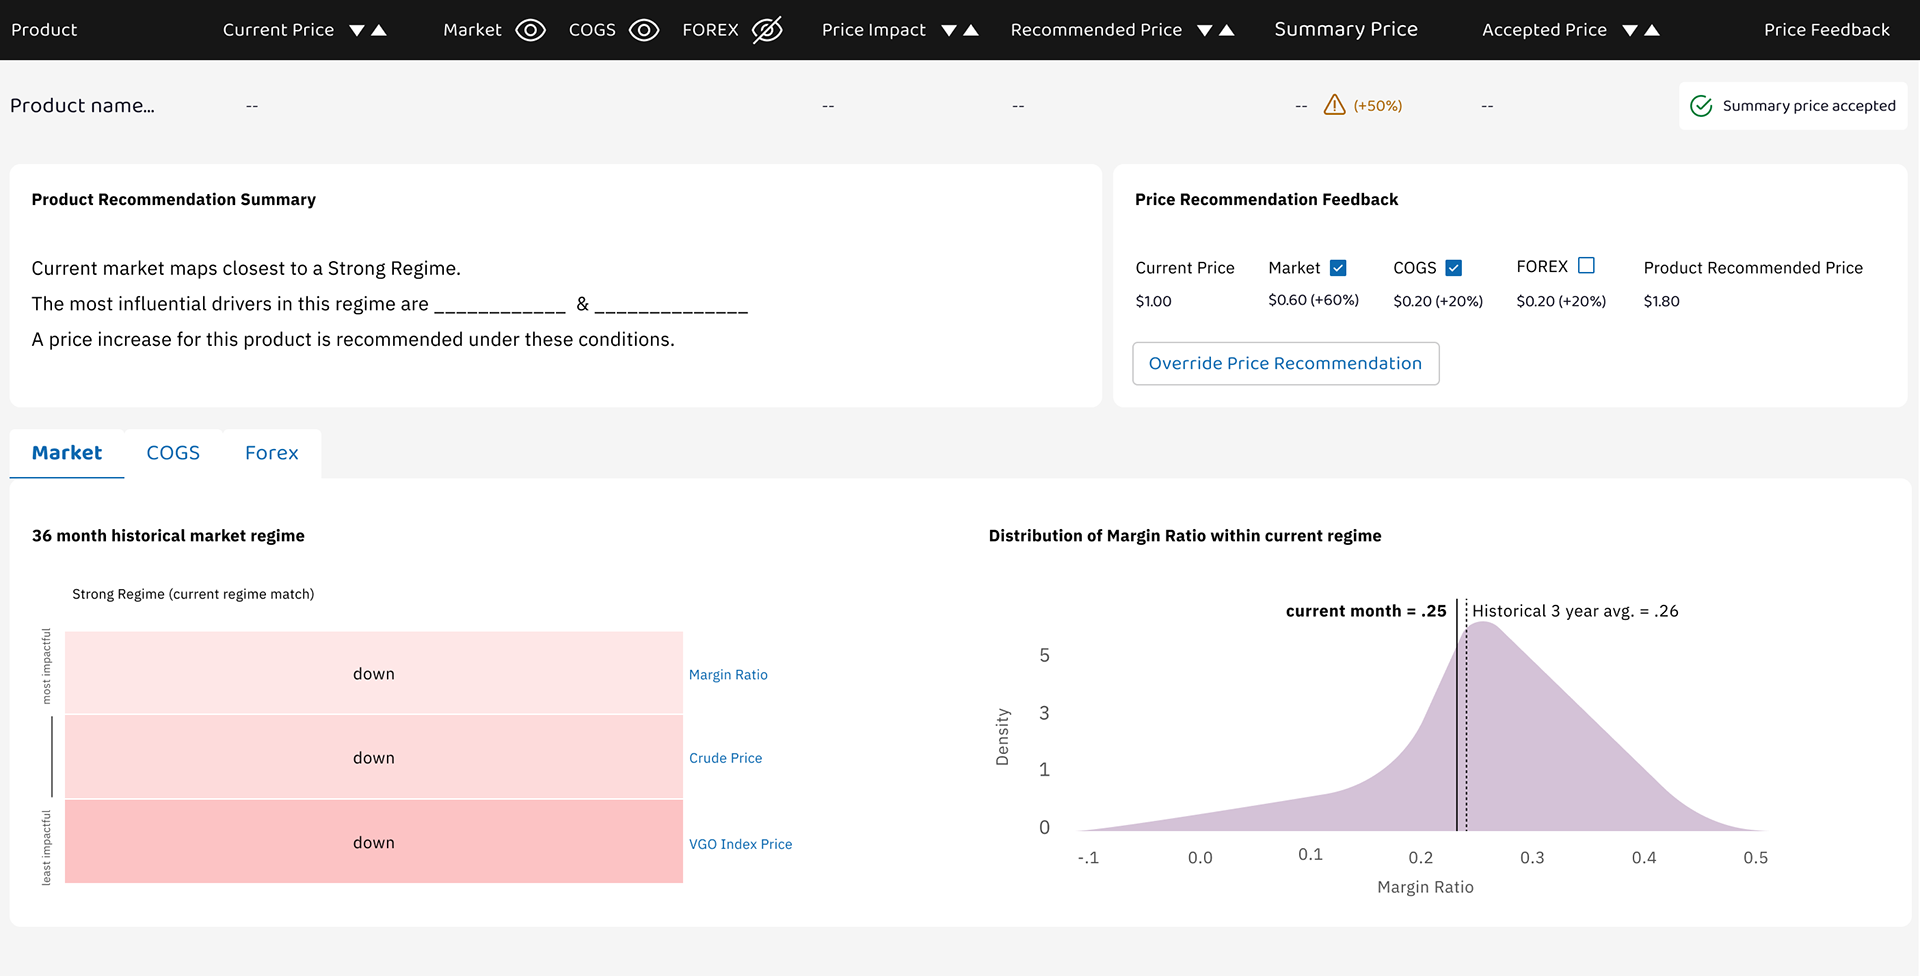
revised product level data

outcome
Product & Revenue teams evolved from using isolated forecasting to leveraging unified multivariate models that deliver market pricing on the individual product level, across all geographies.
Analysts are able to query products with precision, thanks to the design-supported data hierarchy.
Pricing is expressed at both summary and individual product levels, allowing for scaled and granular pricing changes

up next
extracting value from a strong product foundation
User stories drafted in discovery push beyond the MVP, and explore a more proactive approach to finding pricing opportunities across the business.

for the fast tracker
At-a-glance summaries of key pricing metrics & performance indicators
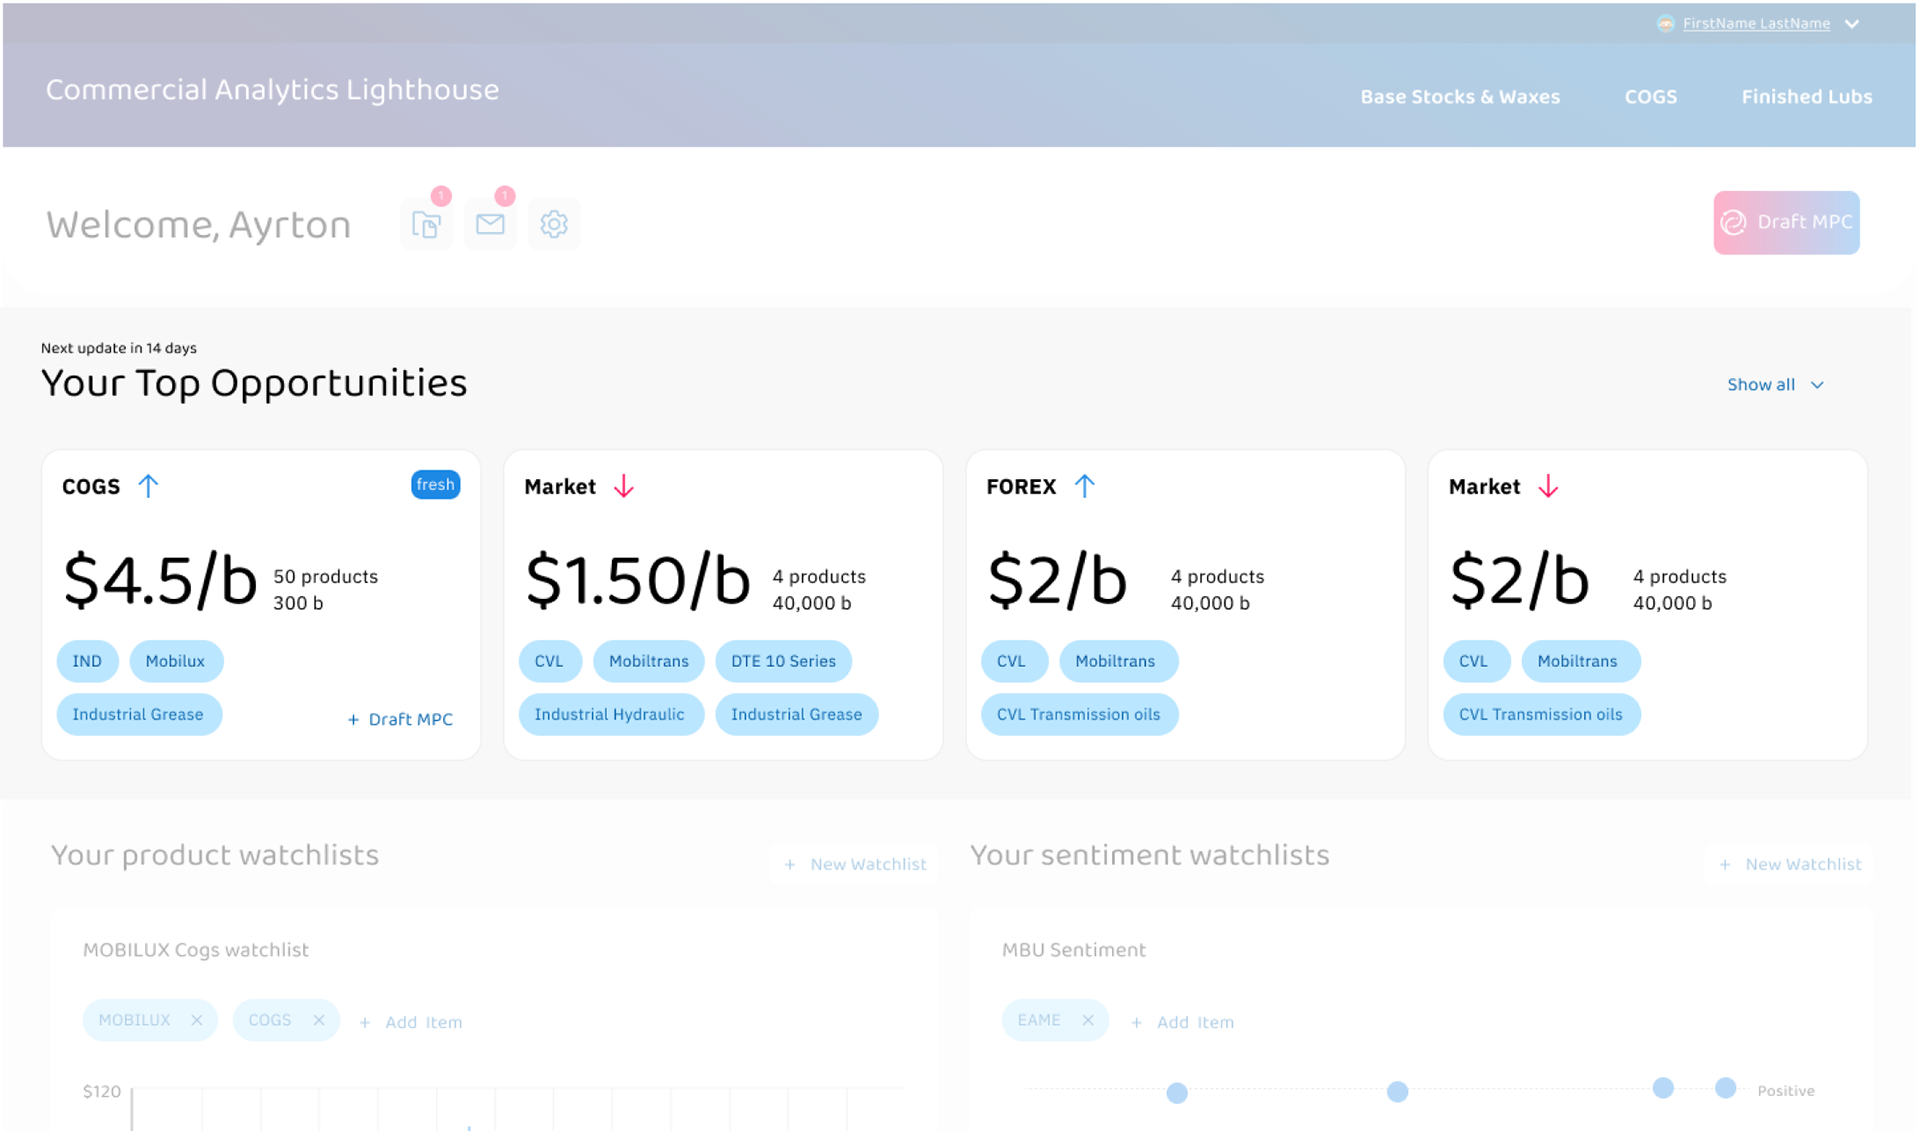

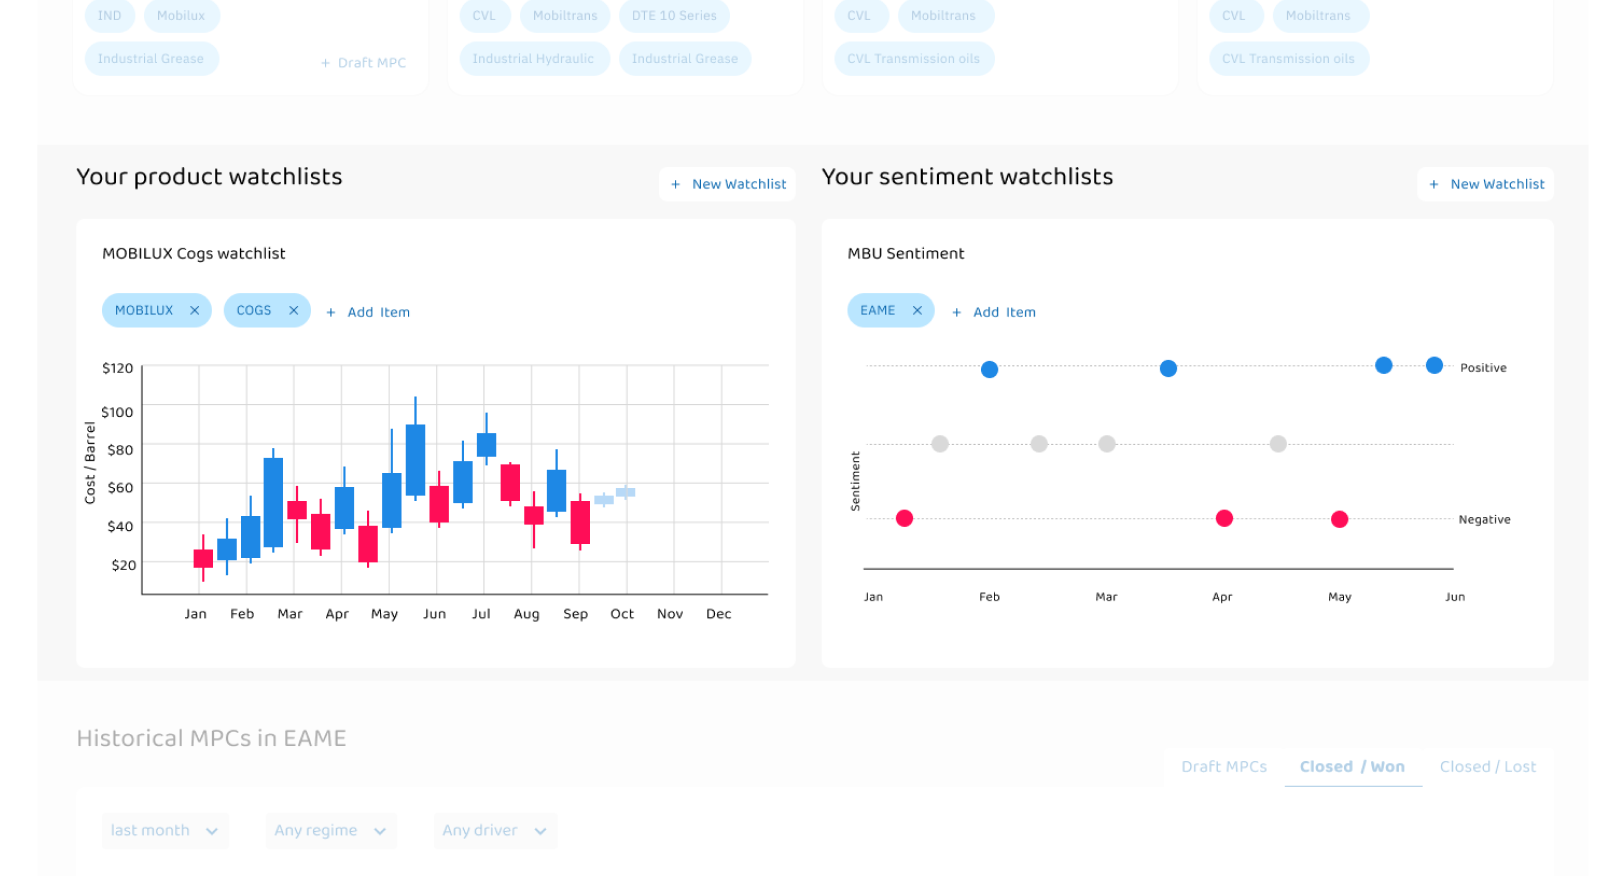
for the scenario player
Providing customizable simulation tools that allow for easy exploration of different scenarios and challenges.
unlocking speed & collaboration
AI-generated proposals
AI powered MPC generation removes the ‘start from scratch’ phase that requires creating scenarios and determining what aspects of the data to showcase.
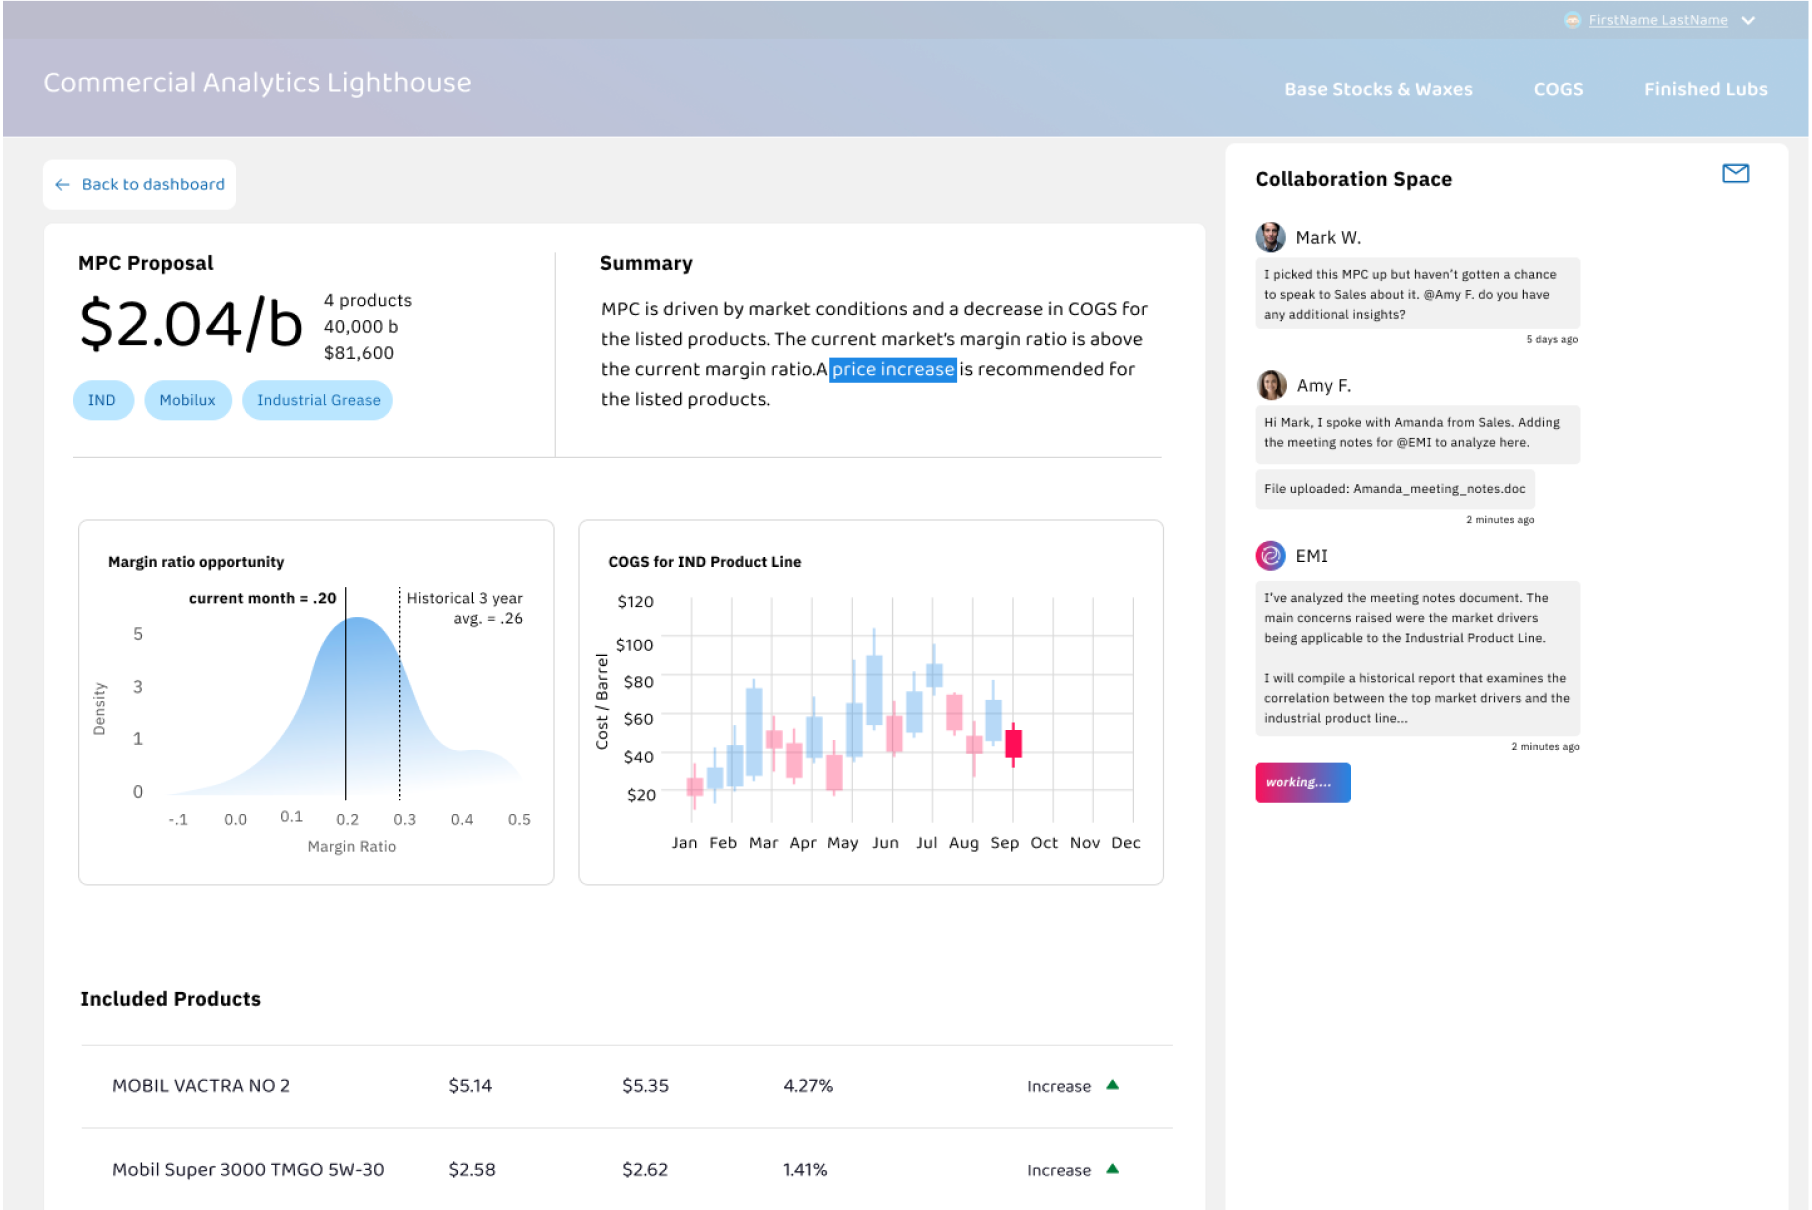
Collaboration space ensures everyone on the team is on the same page, and allows for organized communication, helpful in situations where time is of the essence and details matter.
AI tooling helps lend a hand in analyzing data and aiding in explainability across millions of data points